This is the second tutorial of Learning Chrome Web Developer Tools course. In this tutorial, we are going to customize the Chrome DevTools panel. The last tutorial was about Chrome DevTools introduction. So lets first open DevTools in chrome by pressing Ctrl+shift+I (Windows) or Cmd+option+I (Mac).
Table of Contents
Why Customize DevTool Panels?
We customize panels because sometimes it is difficult to switch between different panels so it is easy if we know how to show multiple panels at the same time in DevTools instead of switching between panels. Similarly, when we need to debug CSS animations, we need to know where is animations panel and how to use it. That is why we need to know how to customize panels in DevTools.
Chrome DevTools can be customized by adding or removing panels on the gray bar on the top of DevTools. Each available panel deals with a different aspect of the web page. Let’s start customizing DevTools.
Customizing Panels
There are different panels available in Chrome DevTools. The most important of them are Elements, Console, Sources & Network(we will discuss them later) & more. We can close only additional panels by clicking the X that appears next to the panel name in the gray bar when you hover your cursor on the tab name such as Layers panel.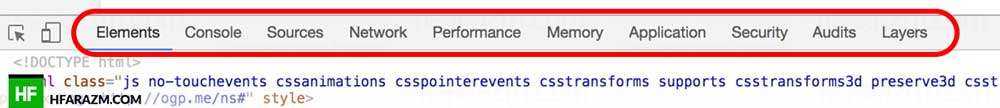
1. How to show hidden panels in DevTools?
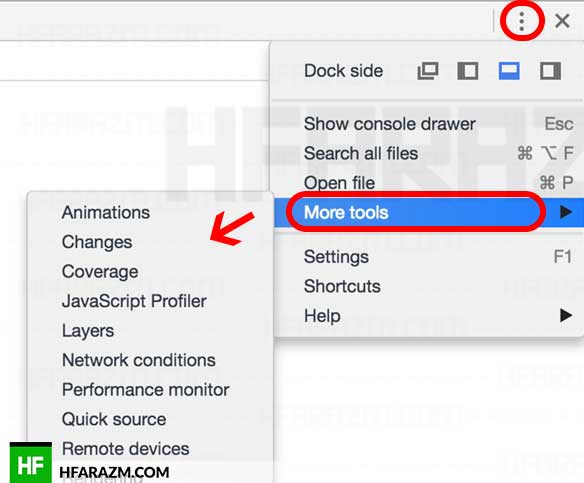
Apart from visible panels, we can add more panels by clicking on ‘customize & control dev tools‘ button on the top right side of dev tools and then click on ‘More tools‘ to choose a panel to show up along other default panels.
For example:
In more tools, Click on any of the available panel names such as Layers, to open it in the main section of the DevTools.
Customizing Console Drawer
1. What is Console drawer?
Console Drawer (picture below shows console drawer) lets you open multiple panels. For example, if you would like to open HTML, CSS & console (Console is used to output errors, info, warning, and messages etc) at the same time then we need to use a console drawer. Otherwise, you have to switch panels to see different outputs of the web page.
2. How to open console drawer?
Console drawer can be opened when you click on ‘customize & control dev tools‘ (highlighted as 1 in the picture below) button on top right of DevTools and then click on ‘Show console drawer‘ or simple press ESC button while DevTool is open. This way you will be able to see Elements panel and console panel at the same time.

3. How to add more panels in console drawer?
When you click on ‘customize & control dev tools‘ button on top right of DevTools and then click on ‘Show console drawer’, the drawer will open up. On the top left of ‘Console Drawer’, you can click on Three vertical dots to choose more panels to show up in console drawer.

4. How to add third-party panels in console drawer?
(Optional) To install third-party panels, for instance, to install ReactJS panel, you need to install ReactJS chrome extension and then open the ‘React based web page’ such as Facebook in a new tab. Now to check if the third-party panel is installed, open Chrome DevTools on React based site and you will notice a new React tab in Chrome DevTools like this: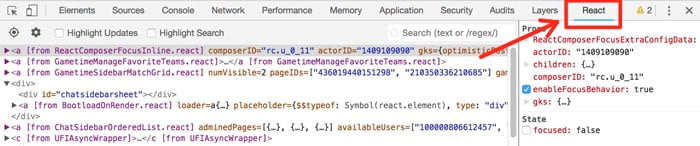
Customizing Settings
1. How to open DevTools settings?
DevTools settings can be found when you click on ‘customize & control dev tools‘ button on the top right and then click on settings. Selecting settings exposes a set of available configuration options. (picture below)
These settings are divided into several sections such as preferences, workspace, experiments & more which are listed on the left side of the opened window.
2. Where are chrome shortcuts listed?
Click on ‘customize & control dev tools‘ button on the top right and then click on settings. At the bottom of the left nav is a shortcuts option which displays keyboard shortcuts for your operating system.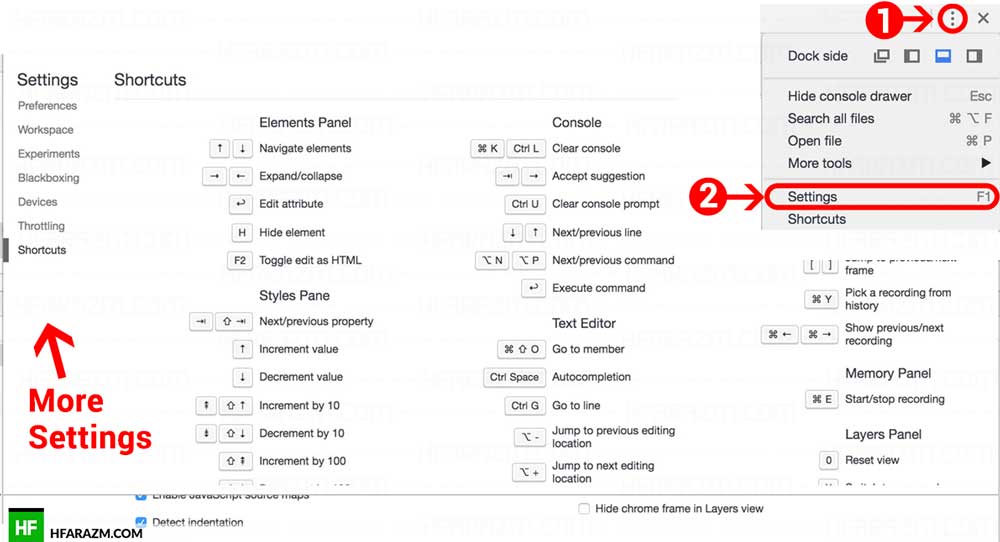
Whats next?
In the next tutorial, we will explore elements panel in DevTools.
In this complete chrome dev tools course, all code files will be available at the end of each tutorial and there will be a quiz to test your knowledge. All available absolutely FREE.
Quiz
[wp_quiz id=”10624″]